SecurityHQ Update • 5 MIN READ
Understanding Business Security Posture
by Eleanor Barlow • Sep 2021
Table of contents
What is a Security Posture?
A Security Posture refers to an organisations/business state of cyber security, and their readiness to respond and react accordingly to cyber attacks, as well as their ability to recover from successful attacks. Factors included when weighing up a companies security posture are the visibility of software and hardware assets, services, networks, and all other information associated with the given company. If a company has a weak security posture it is often more vulnerable, and therefore susceptible to attacks.
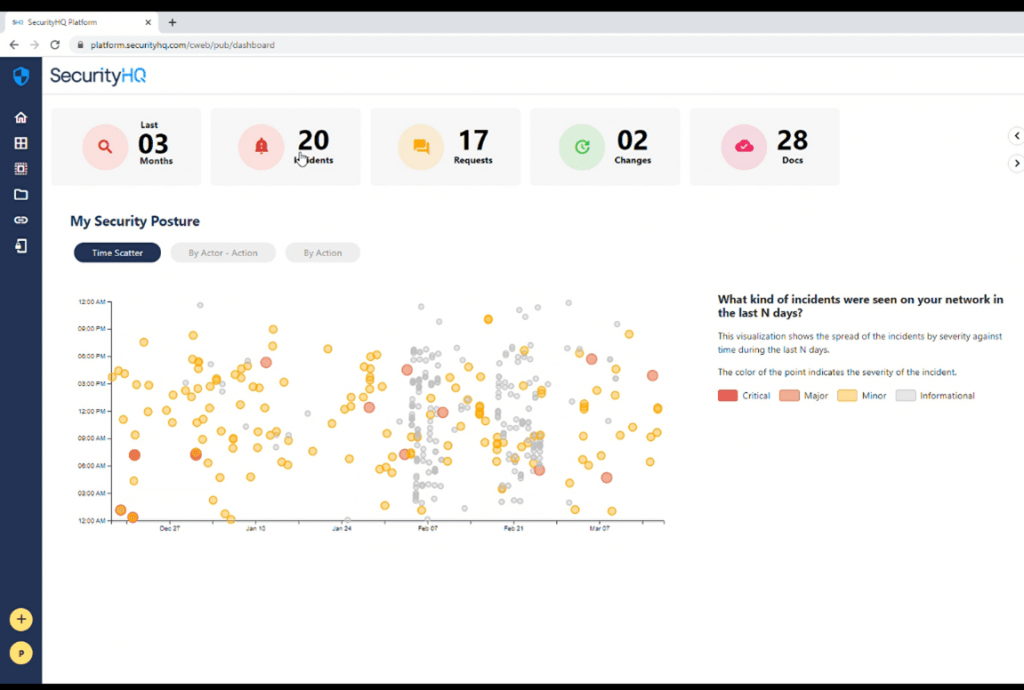
SecurityHQ’s Incident Management Platform is a key window/portal for the customer to log in through, and to gain access to the artefacts and data that has been documented for their account. In this guide, we take a look at how the user can take advantage of the platform to view their security posture via ‘Time Scatter’, ‘Actor’, or by ‘Action’. To start, this is what the main page looks like for a customer logging in. Please note that some elements that would usually be shown on this page have been redacted for confidentiality.
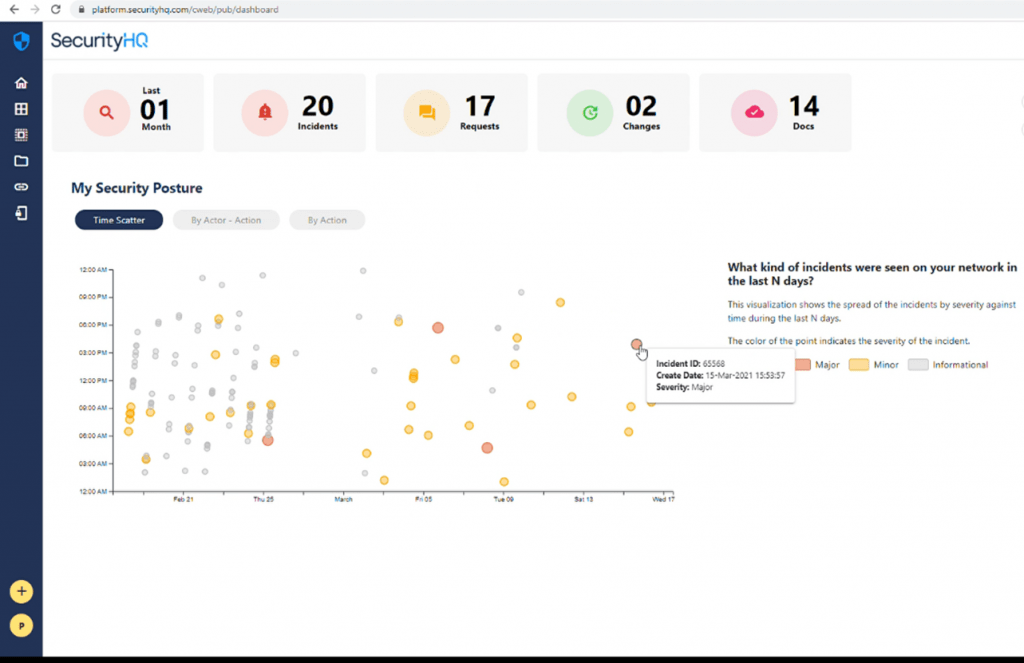
All features on this platform are configured to provide answers to the key questions that SecurityHQ’s customers want answering. The most important question being ‘What does my Security Posture look like?
That’s exactly what the ‘My Security Posture’ section on the dashboard provides the answer to by delivering visual insights into the customers own security posture of the course of a given time frame. All of this is based on the incident data that the platform has submitted for the customer. Depending on the managed services the customer uses.
By default, the duration of ‘Last 01 Month’ is selected above. But other values for the duration can also be selected. For example, the user can view incidents over the last month, last week or even last 24 hours by just toggling the top menu and clicking.
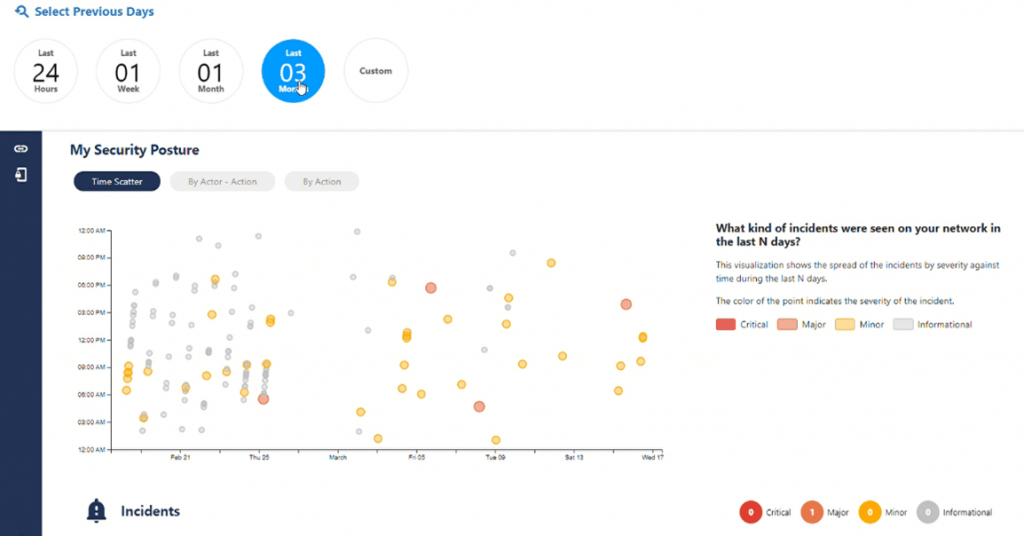
Once selected, the entire section is set to that value of duration and, no matter whether you are visualising ‘Time Scatter’ or analysing the visualisation by ‘Actor – Action’, or ‘By Action’ alone, the duration selected will stay for the last three months, as selected below.
The customer, if required, can also select a customised duration. As shown below, larger durations can be selected. Here we have selected just over a year to analyse Jan 1st 2020 until March 14th 2021.
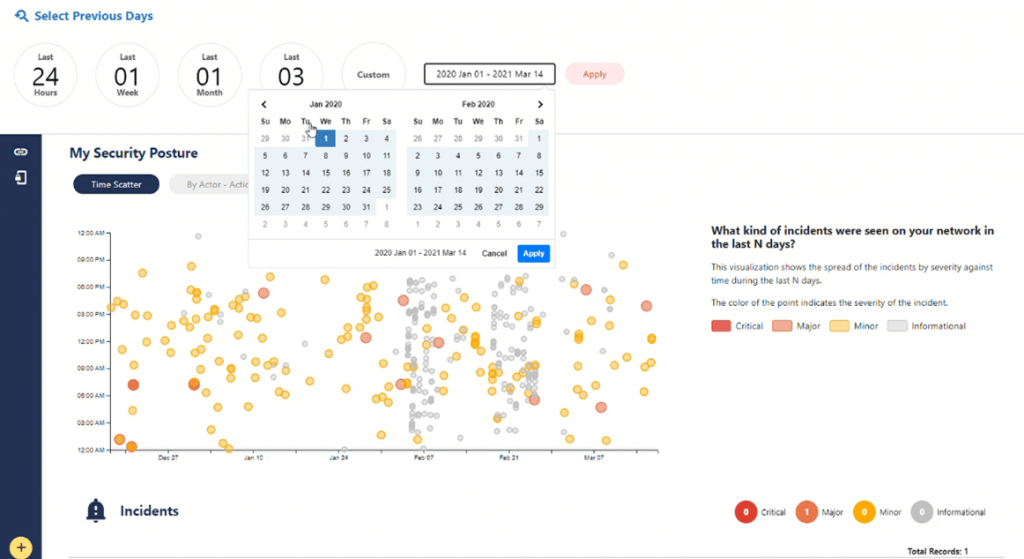
If this customised period is applied, then the widget title will change to ‘Customer Filter’, and the platform will fetch the data for the duration selected.
This feature is very insightful to understand how their security posture has developed in recent times, or during a specific period. The data from this may lead to further questions for the Security Operations Centre (SOC) team and encourage customer engagement with the SOC to improve security posture. This platform is presented to the customer to help them engage with their own security data. And to work seamlessly with the backend SOC teams assigned for their account.
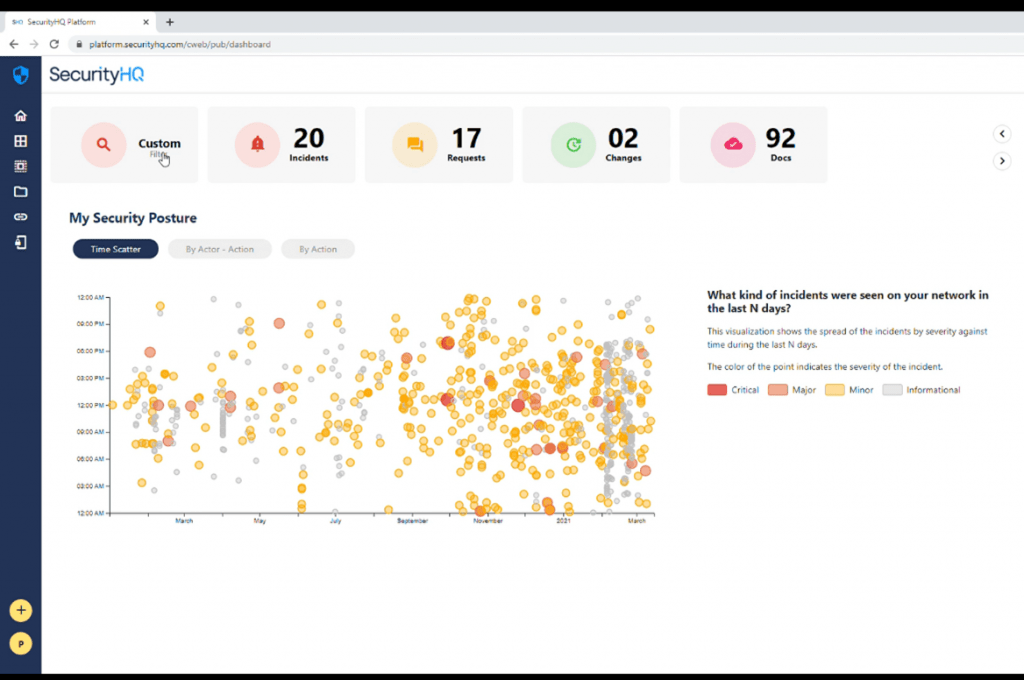
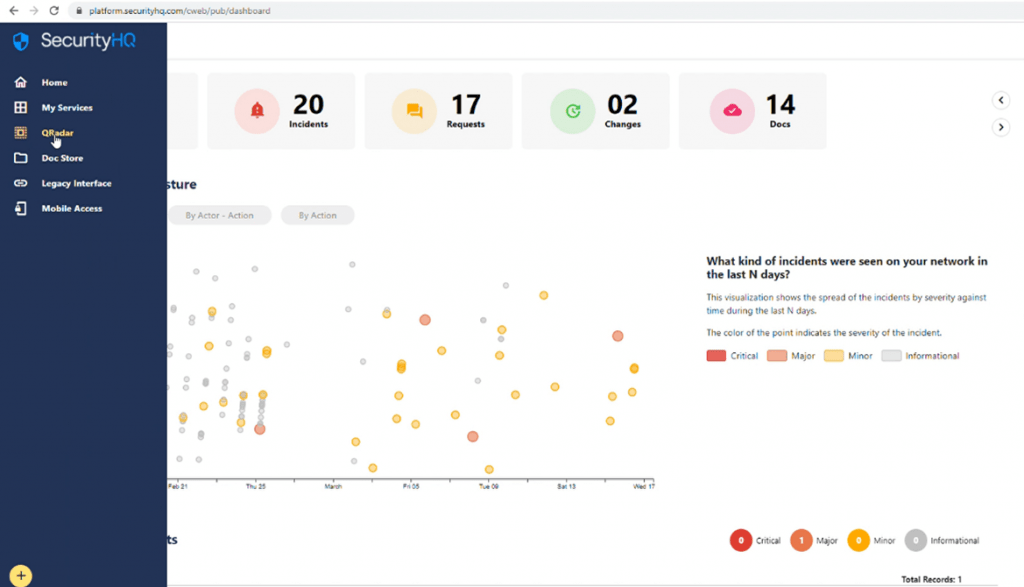
In essence, the time scatter analytics visualisations are to provide a visual que. And as you can see below, the causes for each incident. As shown, the number of informational incidents are quite high, during the presented period below.
This could be something that the customer may want to get more details of, and dive into at more depth. Let’s say that the last month of the duration is selected, we can see that a significantly higher number of incidents occurred during this period.
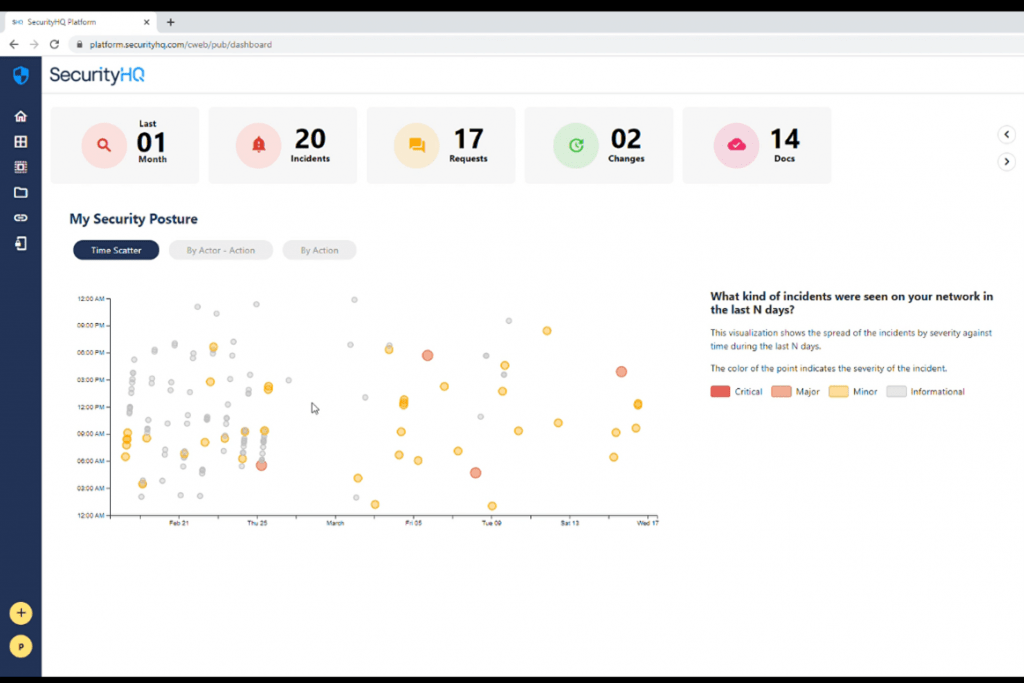
Those incidents can then be visited, and the customer is instantly provided with the details into what kind of incidents those where, what reasons or factors lead to these security incidents, and then put in place the right measures, and see what measures have been taken by the SOC team.
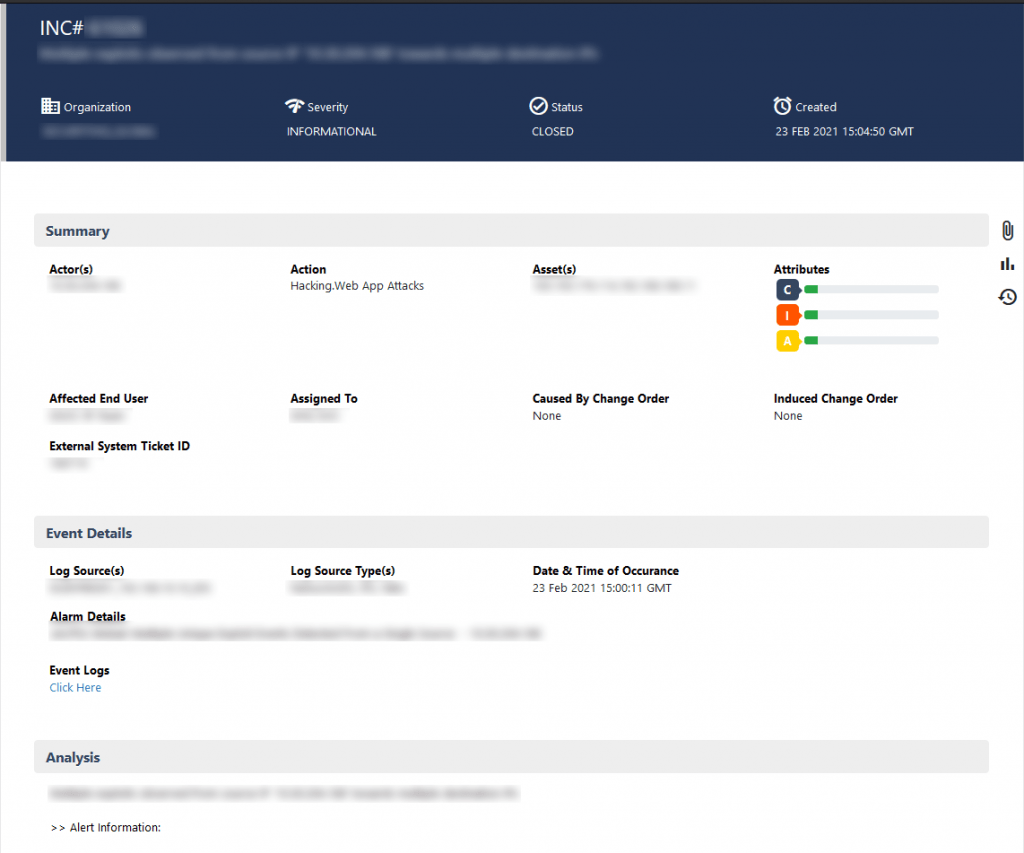
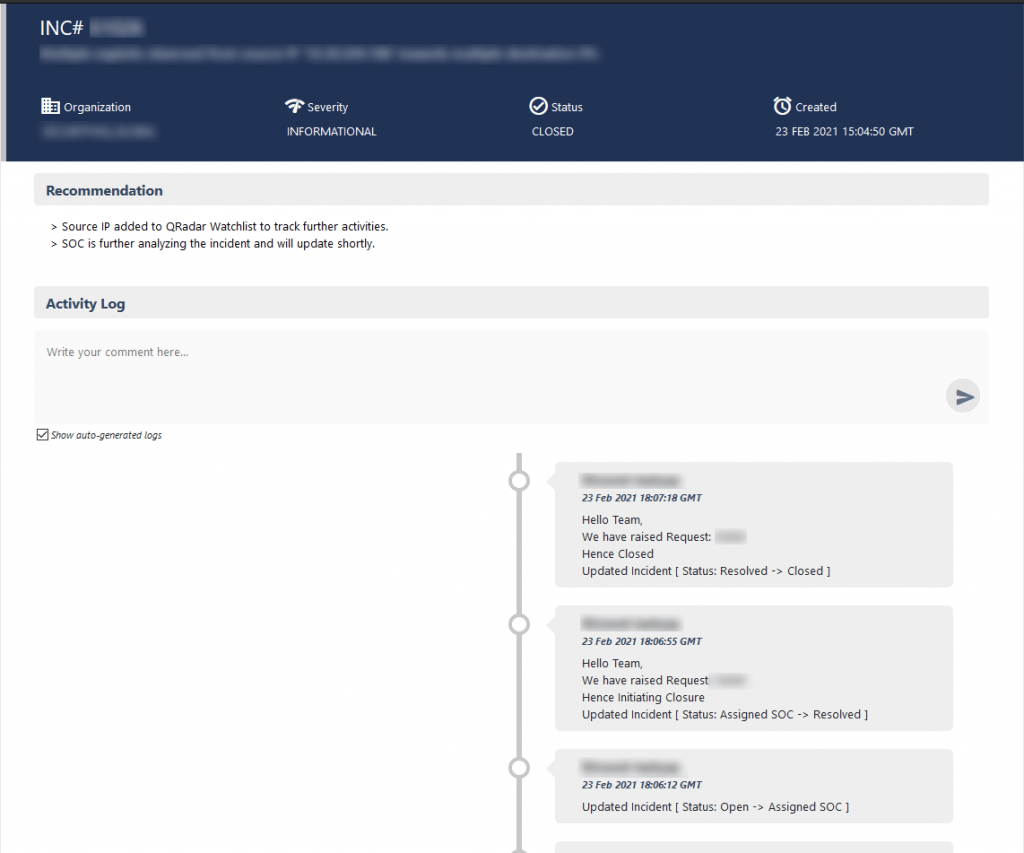
This needs the user to engage with the SOC teams. And this is easily made by leaving a comment in the ‘Activity Log’ and sending this comment to the incident management team for them to analyse and respond.
See the ‘Actors’ Behind the Security Incidents
The next useful visualisation a customer can view on this main page, are the insights of the actors behind security incidents. Actors are classified into three groups, Internal Actors, External Actors and Unknowns.
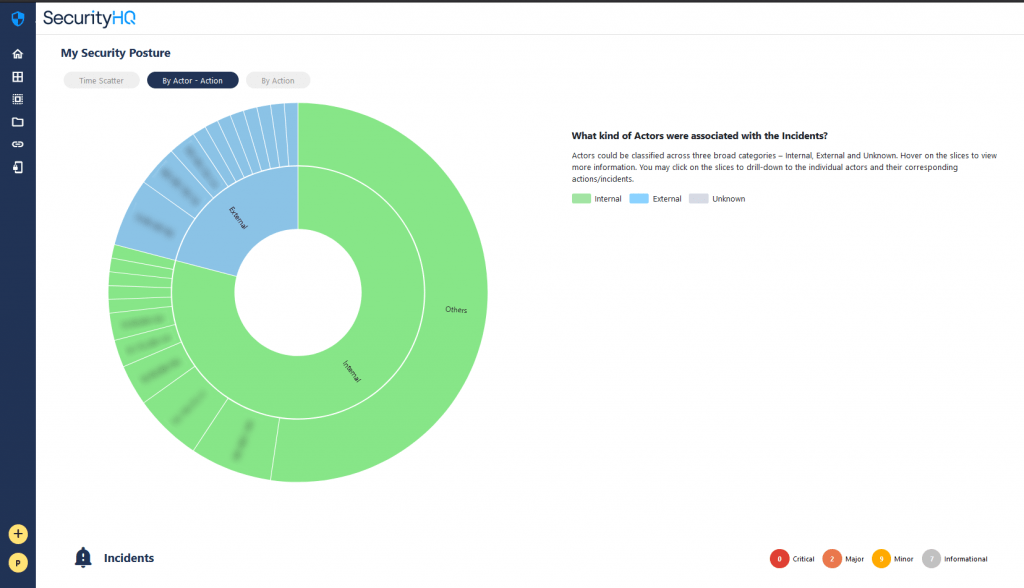
Unknowns are the actors that could not be categorised into internal or external groupings.
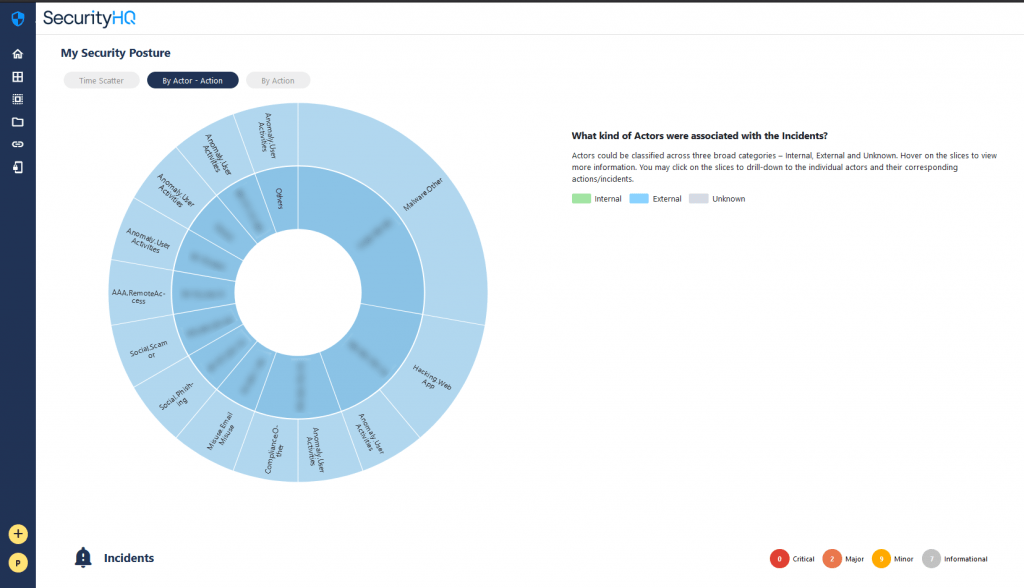
All of these visualisations are interactive, and the customer can click on a selected/required category to drill down further. A click on the external category shows the external actors, their identities revealed, with the IP’s now visible.
Each segment can be viewed to see what the IP is of each actor, how many incidents there are, and what these incidents are contributable to. If requires, the user can click on a particular IP/actor slice, and all the incidents which have that IP are presented to the customer.
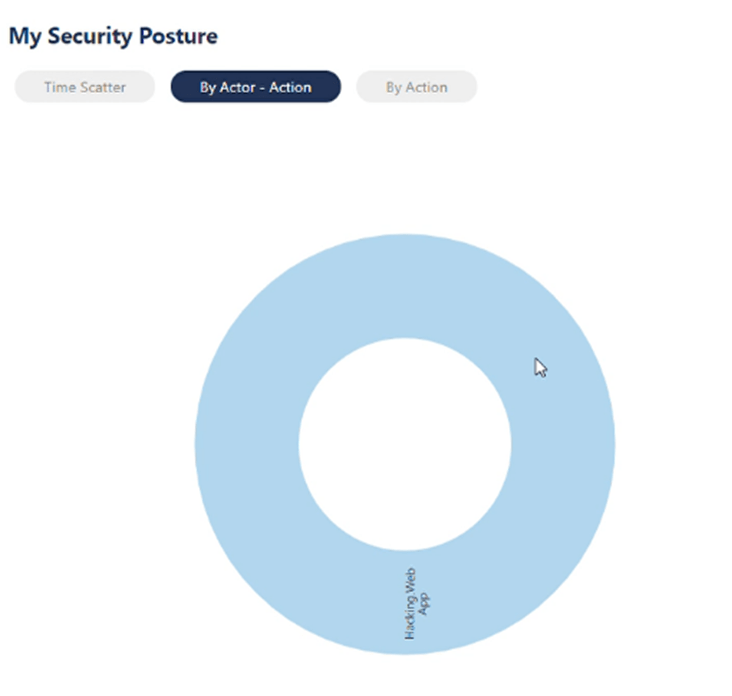
These details help the customer to understand what has led to a particular security incident, and what security measures have been taken. The user can go back by clicking on the centre of the widget, for an overall view of threats.
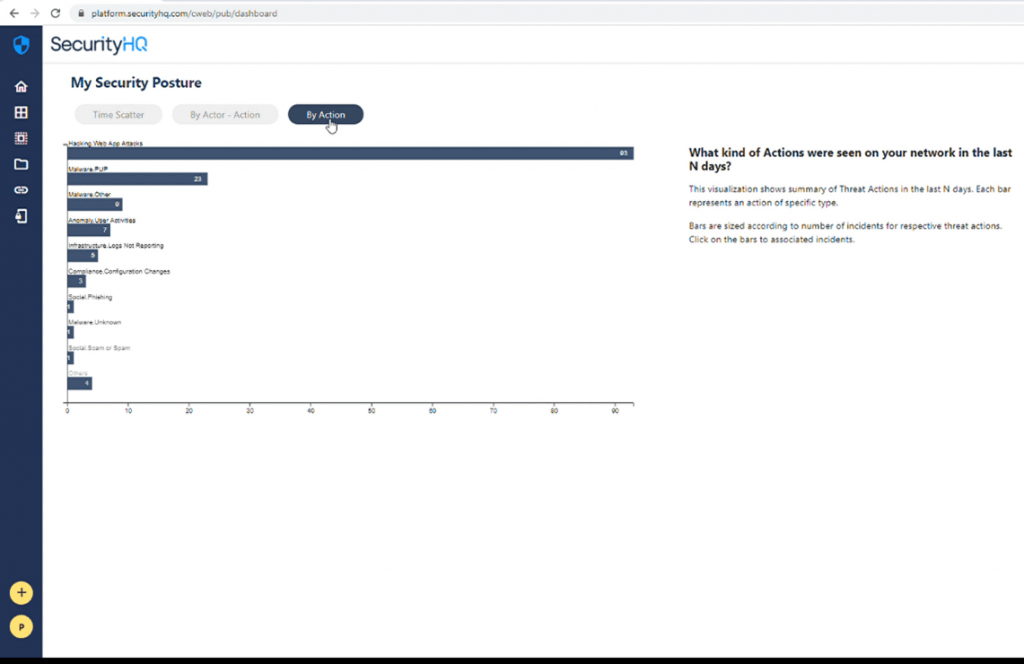
See the ‘Action’ Behind the Incidents
The third category is to visualise the same data via the action behind the security incident. Actors basically use different kinds of threat vectors, and their intent can differ behind each attack/activity. That is also an important aspect for the customer, as well as the SOC, to keep a tab on.
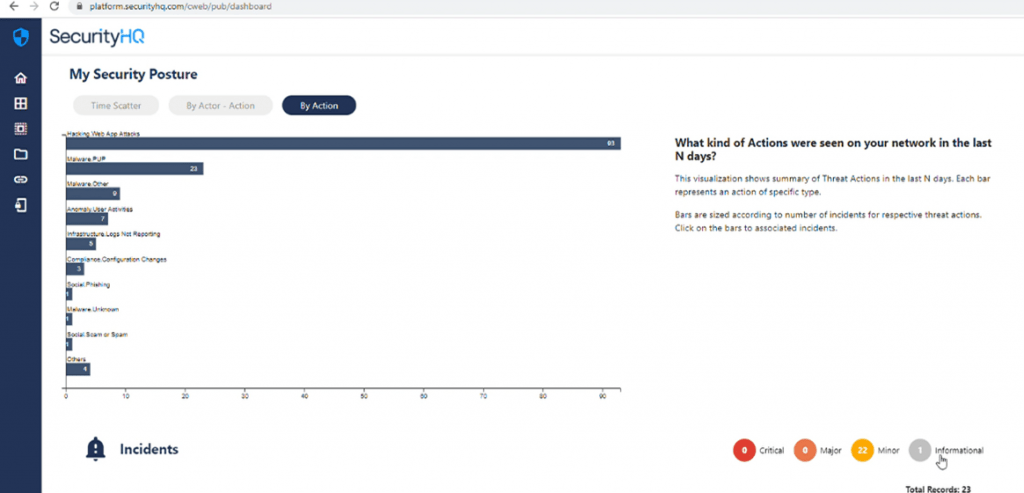
The key question answered here is, mainly, ‘What kind of activities are prominent in my account?’.
This tool answers this by showing the specific types of Actors. For example, if we take the image below, the top five categories for this account show a lot of hacking actions on the customers web apps. Followed by that is a high number of activities in the malware category. And there are also a couple of compliance and configuration changes which also led to security incidents.
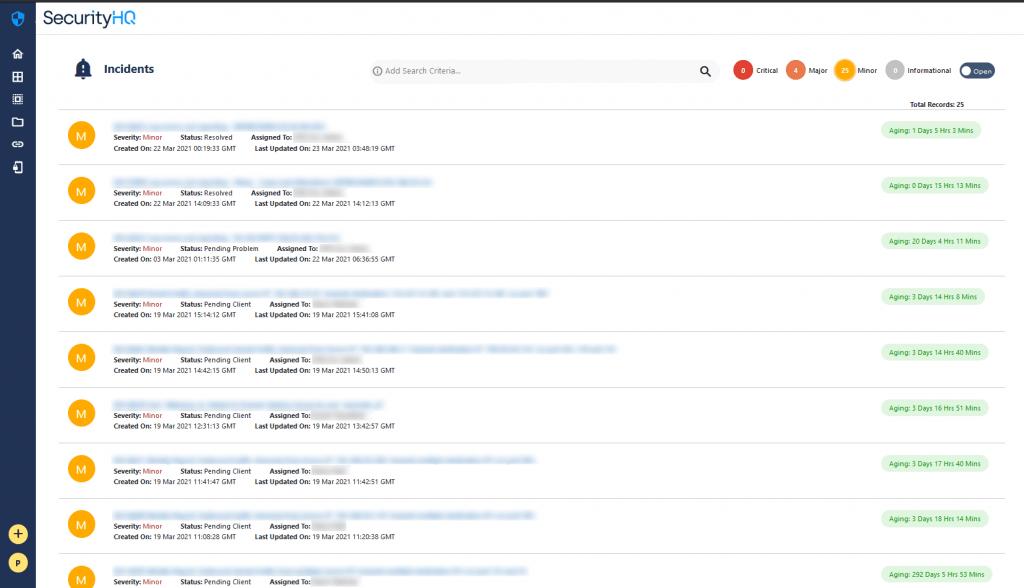
Each of these categories can be clicked upon. And from this, the incidents are filtered down. On the provided list of security incidents, there is a widget (bottom right) to present the severity of actor types. The types are categorised into ‘Critical’, ‘Major’, ‘Minor’ and ‘Informational’. Here all three incidents happen to be ‘Informational’.
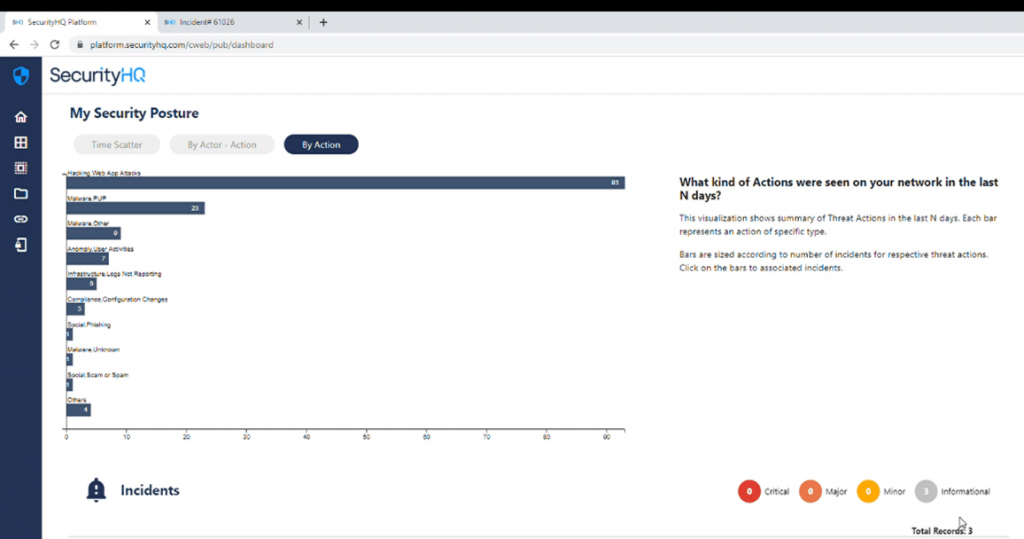
But if you go to a larger category, for instance the bar labelled ‘Malware PUP’, you can see that there are 22 Minor incidents and 1 Informational Incident.
Whenever this widget shows, this is a tool to filter down, so if the customer wants to view only the informational incidents, he can click on that category, and only those incidents for that category will be filtered.
These three features are intended to serve as a good starting point for the customer to understand their current security posture and to better comprehend the recent period of incidents.
Fully integrated with an Enterprise-Grade & Gartner leading SIEM Technology: IBM QRadar
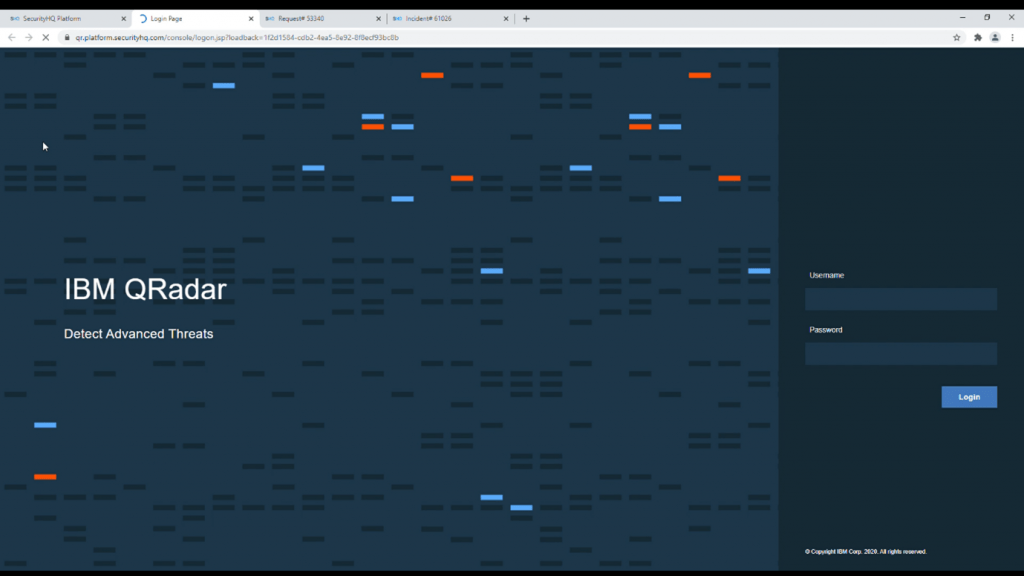
Now, moving back to the application on the interface’s menu, a key element for the customer to access is the QRadar interface. One click on the QRadar menu, and the user will be taken to the IBM QRadar interface that has been embedded.
The credentials to be entered here are the same as the platform credentials, and the QRadar interface will be presented to the customer.
Our services and features, such as Managed Data Security, powered by IBM Guardium, can be accessed to help clients protect critical data, prevents leaks, and ensures compliance across heterogeneous environments, including databases, data warehouses and big data environments.
Or Managed Detection & Response (MDR) can be used to help customers visualise and understand malicious or anomalous activity. Analyse, prioritise and respond to threats in rapid time, safeguard data, people and processes.
Anytime-Anywhere Collaboration
SHQ Response Mobile App for Android and IOS puts the power of our Global Security Operation Centre in our client’s hands.
The new app has significantly advanced the accessibility and visibility of our services and provides a considerable competitive advantage in terms of customer experience and engagement, so that users can do everything that they are able to do on the platform, now from their phone.
Including the ability to:
- Track the status of security incidents at any time, while working remotely.
- Prioritise and escalate threats.
- Respond to threats.
- Create and search for tickets.
- Receive real-time alerts and notifications for security incidents.
- Call designated SOC team.
- Receive crucial notifications with the click of a button.
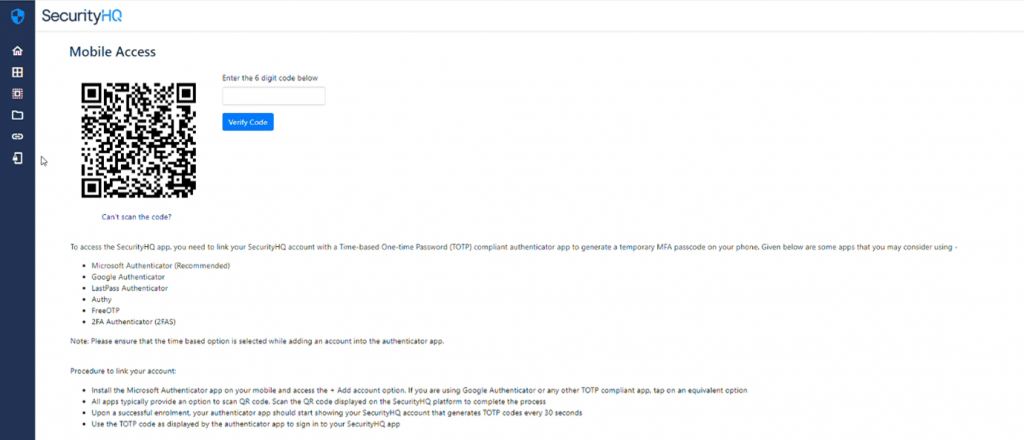
When the user clicks on the ‘Mobile Access’ button, this page provides instructions for the enrolment of the mobile app, against the web platform. That way, customers can see all their SecurityHQ services, and access all required features, while on the move.
To learn about the many other features available on our Incident Management Platform, read more here.