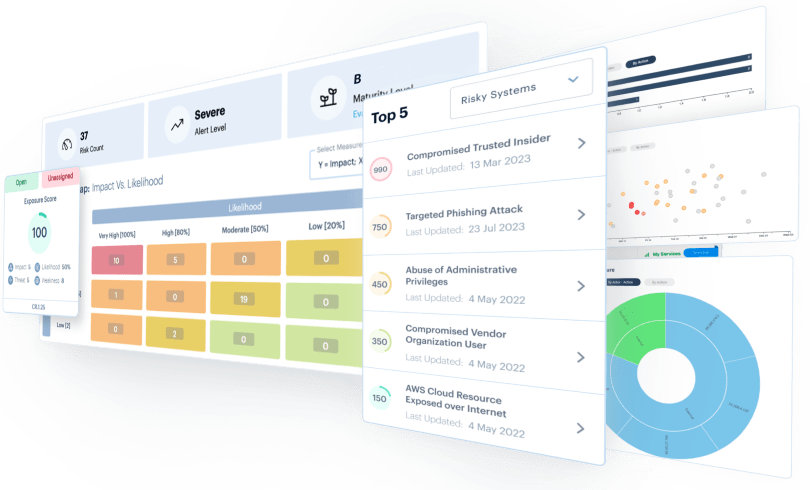
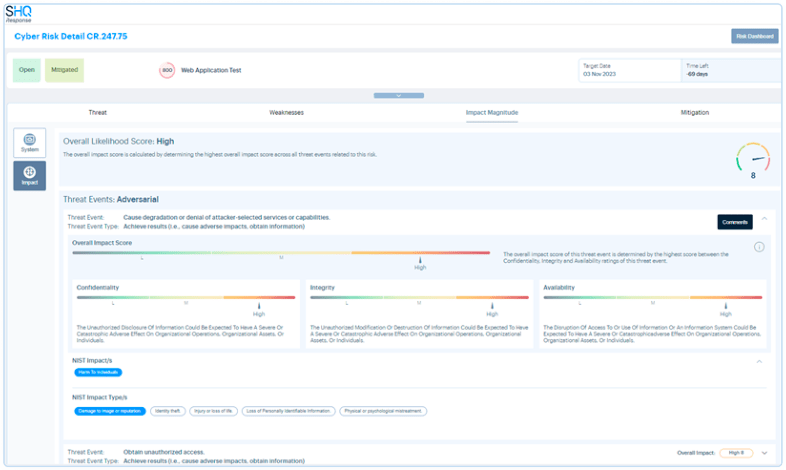
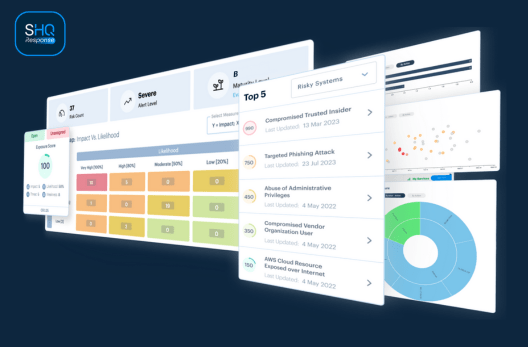
Visualise
The SHQ Response Platform interface has been designed with the objective to introduce modern standards around data-driven documentation, so that information can be presented quickly and intuitively. To do this, visuals need to be interactive. That way, by inspecting data visually through a time series graph or sunburst chart, you can drill down into the data to identify an accident, its trends, and how this information relates to other artefacts.


Prioritise
SecuriyHQ’s algorithms calculate incident risk by considering the classification attributes, in accordance with VERIS, that contribute to the magnitude of the problem, such as the Kill Chain, Mitre ATT&CK, victim counts, asset criticality, and more. Analysts then apply predictive risk factors that increase or decrease the degree of risk. The output is a contextualised risk assessment for each incident. So that you know exactly what to tackle first!


Connect
Interoperability is key. Our unified interface provides seamless access and collaboration via remote SOC’s, and between tooling (SIEM, EDR, SOAR), IT security teams for the handling of playbooks for incident handling, vulnerability management and change management. Members can collaborate across IT and Security teams, to prioritise, remediate and rapidly respond to security risks. Escalate and action tasks to your ITSM tooling, including ServiceNow, Jira, and Remedy.


Respond
Incident response requires advanced analysis, combined with an accurate assessment, categorisation, and a playbook for investigation and response.

Technology Stack
Unparalleled Leading Technology. SecurityHQ Only Uses the Best.

SHQ Response Mobile App
Communicate with Your SOC Team Instantly

Key Features

Real Time Dashboard
Data representation in real-time to understand and provide the actual status and actions required.

IBM Resilient SOAR
Orchestrated playbooks for incident response and automation for rapid containment of threats and isolation of compromised systems.

Collaborative Incident Notification
Notifications with analysis, recommendations, timeline analysis, and activity tracking.

Automate Containment
Accelerate response to threat containment by automated response to block communications and isolate infected machines.

Interactive Visualisations
Data driven interactive visuals to inspect and represent data that identifies risks & problems.

MITRE ATTACK Mapping
Incident attacker actions mapped to MITRE ATTACK tactics and techniques.
See it in Action and Request a Demo Today
This site is protected by reCAPTCHA and the Google Privacy Policy and Terms of Service apply.